"Mélodies" project
Detailed page is here"Cascade" project
Detailed page is hereMore examples on seismic data sonification
Our Demo presented at CMMR in Marseille, Oct. 2019, got the "best demo award"!!
try this link for the quickest path to movies and sounds!Kilaeua volcano
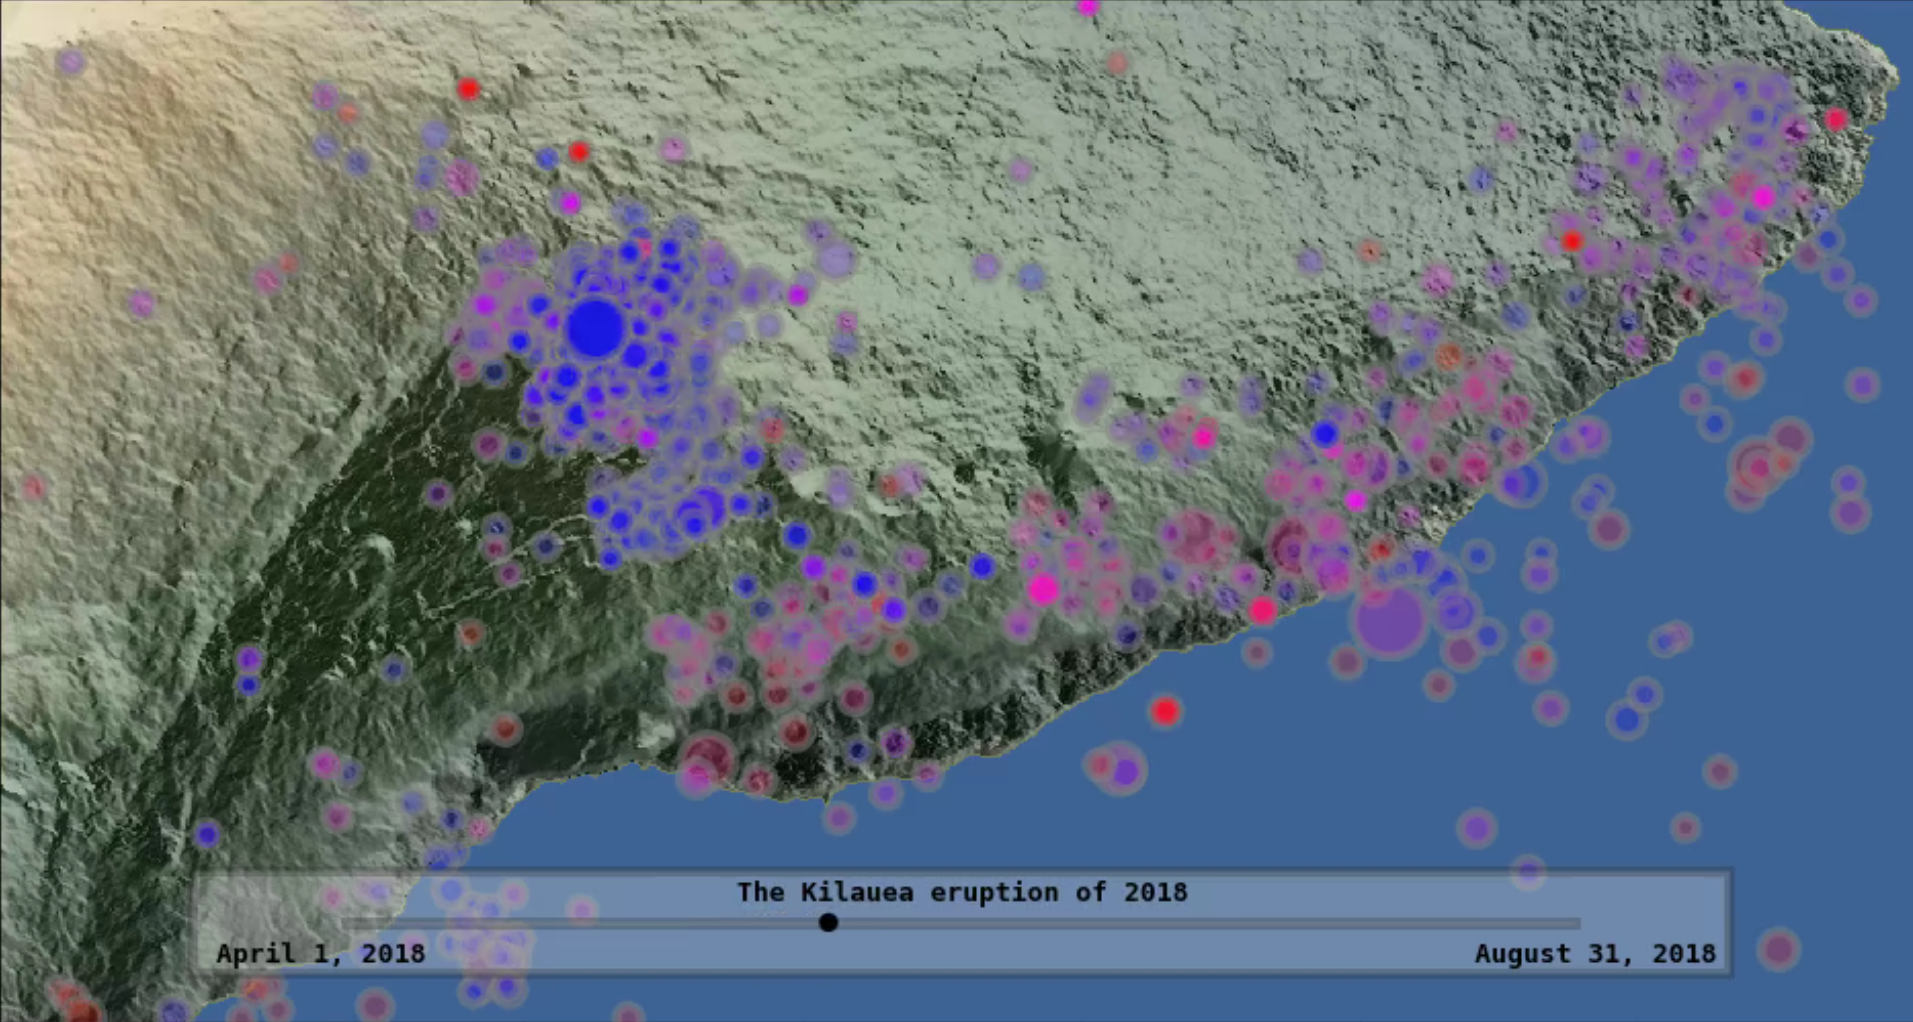
Context
The eruption of the Kilauea volcano on Hawaii in the summer of 2018 marked the end of a long eruption phase that began in 1983.
First, two "tectonic" earthquakes occur off the SE shore of the island. Soon after, seismicity migrates to and rapidly increases in the vicinity of the crater. Then it enters a phase in which a Mag. 5 earthquake occurred every single day for over a month, which is extremely rare. Each event was preceded by a rapidly increasing number of foreshocks (like popcorn popping) up to the time of the >M5, followed by a brief silence (~2 hours), and then a repeat. These earthquakes had no aftershocks, only foreshocks, which is also extremely rare.
Also, every day, there was an eruption of lava out of vents that were opening up about 40-50 km east of the volcano, down the rift. It is known that the lavas in the Kilauea caldera (crater) are the same as those that were erupting down the rift, strongly suggesting that the cyclic patterns reflected a coupling to the dynamics governing those eruptions. The scratching sound may be associated with magma moving through the crustal "plumbing system" to the vents.
Can we hear the spatio-temporal patterns? Can we track down the lava flow?
Data
- Catalog of 41,328 events greater than M1.5
- Discrete seismic recordings for each event (80 seconds, fs=20 Hz)
- Observation window: 5 months (April to August 2018)
Sonification
Track compression with factor 132,192 (5 months in 100 seconds)
- "K1": audification of the seismic waveforms, compressed in time: speed factor 267 (80 second-events -> 0.3 second-sounds), each waveform placed at the correct relative time in the timeline.
- "K3a": each event replaced by a sound (clicks). Catalog of 41,328 events greater than M1.5
- "K3b": each event replaced by a sound (clicks band-passed around 4 410 Hz, Butterworth filter of order 1 and quality factor 1). Catalog of 41,328 events greater than M1.5
- "K3c": each event replaced by a sound (descending chirps, from 300 to 150 Hz). Catalog of 41,328 events greater than M1.5
- "K3d": each event replaced by a sound (descending chirps, the higher the magnitude, the lower the start frequency). Catalog of 41,328 events greater than M1.5
Spatialization Rendered movies and sound tracks are available here for 4 speakers, 1 at each corner of the region of interest (DBAP technique -- inverse squared event/speaker distance -> speaker amplitude)
Episodic tremor and slip (ETS)
Context
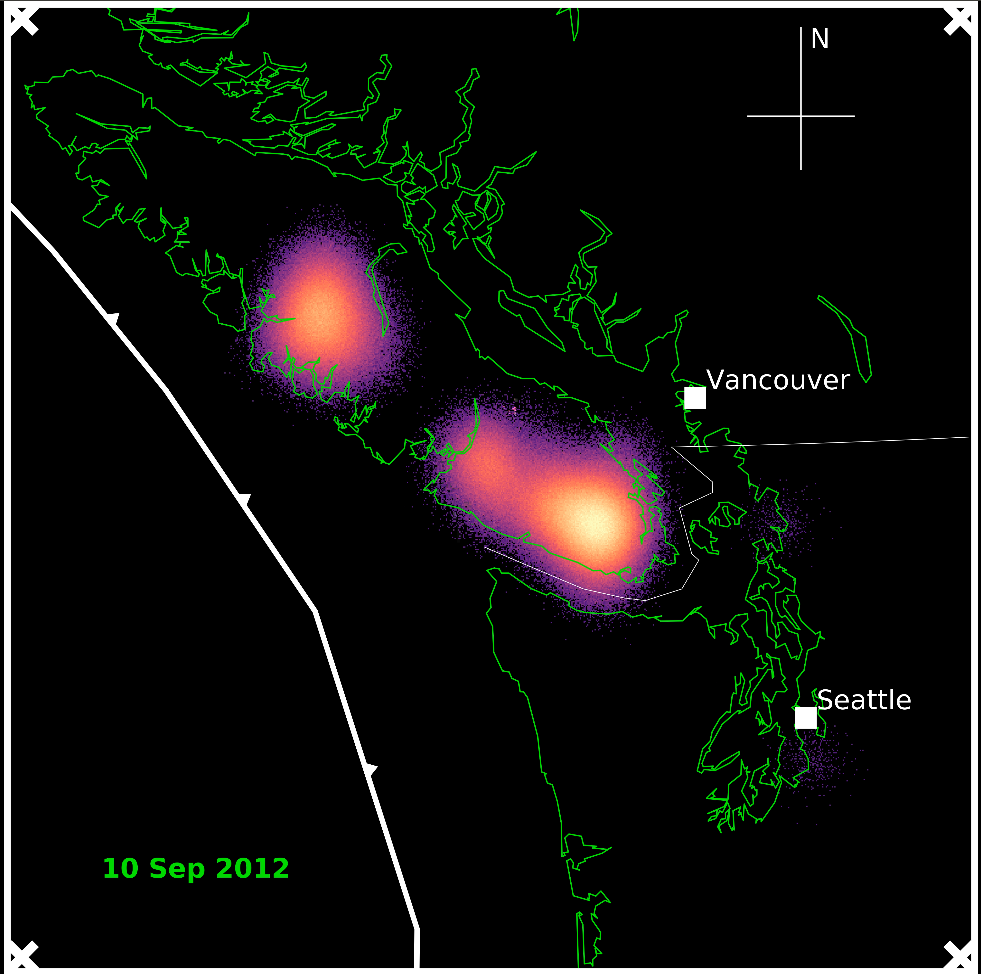
In the subduction zone of the northwestern coast of the USA and Canada, "slow" earthquakes are observed (lasting ~ 2 weeks every 14 months in this region).
They send out very weak, but long-lasting seismic waves compared to regular earthquakes, called "tremor".
The location of the tremor in time - approximately the location where the slow-earthquake process is active - can be followed by locating the source of the seismic waves at depth (~ 40 km deep on the subduction fault).
The relatively slow velocity of the process allows us to track the slow-earthquake migration process along the fault.
Can you hear it moving?
Data
- 33880 six-minute-long seismic recordings (fs=20 Hz) from 55 stations
- Observation window: 5 months
Sonification
Track compression with factor 264,384 (5 months in 50 seconds)
- "E1": audification of seismic waveforms, acceleration factor 360
- "E2a": envelope extraction from seismic waveforms, filled with Gaussian noise (low-passed at 300 Hz)
- "E2b": envelope extraction from seismic waveforms, filled with Gaussian noise (band-passed between 100 and 3000 Hz)
- "E3a": each recording replaced by a sound (clicks)
- "E3b": each recording replaced by a sound (clicks band-passed around 4 410 Hz, Butterworth filter of order 1 and quality factor 1)
- "E3c": each recording replaced by a sound (descending chirps, from 300 to 150 Hz)
- "E3d": each recording replaced by a sound (descending chirps, the higher the magnitude, the lower the start frequency)
Spatialization Rendered movies and sound tracks are available here for 3 speakers, at the NW, NE, and SE corner of the region of interest (DBAP technique -- inverse squared station/speaker distance -> speaker amplitude), or for a stereo setup
Earthquake swarms in Pollino National Park, Italy
Context
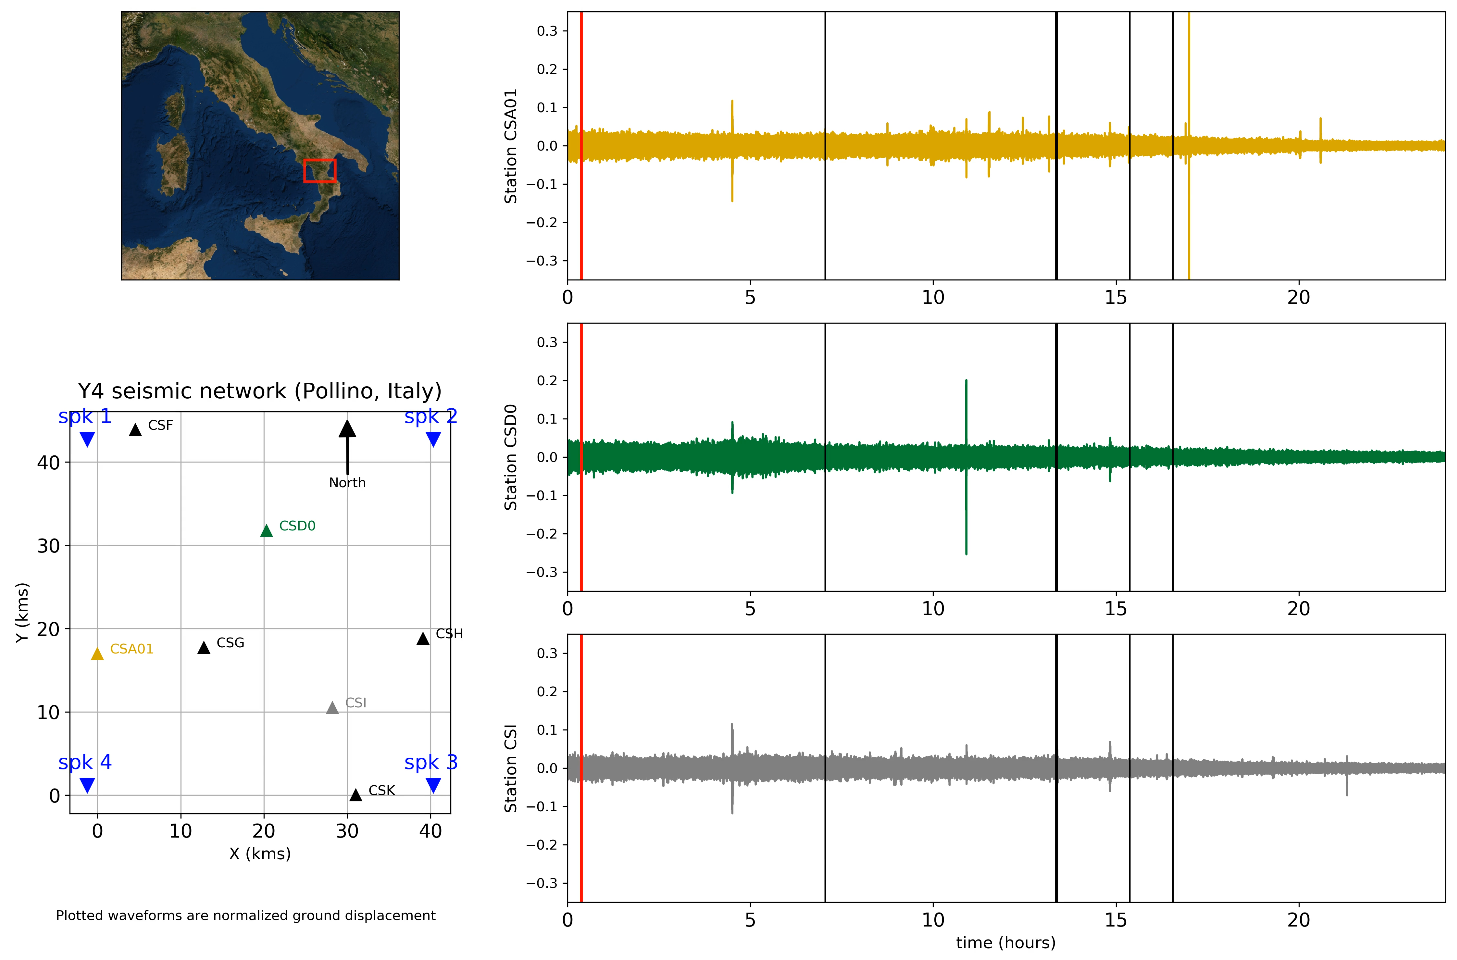
We observe the micro-seismicity in the South of Italy (N-E of Calabrian subduction zone).
Made of thousands of small earthquakes, the swarm sequence started in October 2010 and continues since then (max. magnitude: 5.0 on 10/25/2012).
Can we hear the spatio-temporal patterns within the swarm? Can we tell relevant seismic information from noise, including anthropogenic noise?
Data
- Continuous seismic recordings (fs=20 Hz) from 7 stations
- micro-seismicity -> event catalog non-existing or non-relevant
- Observation window: 24 hours (April, 29th 2015)
Sonification
Track compression with factor 1440 (1 day in 1 minute)
- "P1": audification of seismic waveforms
- "P2a": envelope extraction from seismic waveforms, filled with Gaussian noise (low-passed at 300 Hz)
- "P2b": envelope extraction from seismic waveforms, filled with Gaussian noise (band-passed between 100 and 3000 Hz)
Spatialization Rendered movies and sound tracks are available here for 4 speakers, 1 at each corner of the region of interest (DBAP technique -- inverse squared station/speaker distance -> speaker amplitude)